2.1.5 Market Segment Positions on the Perceptual Map
Market segments have different positioning preferences. The Low End segment is satisfied with inexpensive products that are large in size and slow performing. It wants products that fall inside the upper-left set of dashed and solid circles in Figure 2.2 The High End segment wants products that are faster performing and smaller in size. It wants products that fall within the lower-right set of dashed and solid circles.
Over time, your customers expect products that are smaller and faster. This causes the segments to move or drift a little each month. As the years progress the locations of the circles significantly change. The example in Figure 2.3 shows the location of the market segments at the end of the fourth year. Figure 2.4 shows the segments at the end of the eighth year.
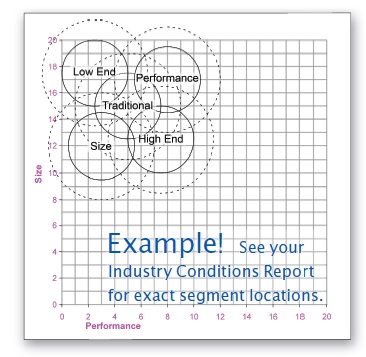
Figure 2.2 Beginning Segment Positions: At the beginning of the simulation, segment positions are clustered in the upper left portion of the perceptual map.
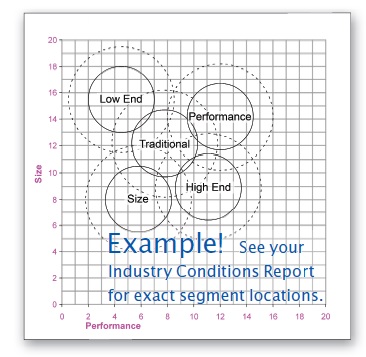
Figure 2.3 Segment Positions at the End of Year 4: The overlap between the seg-ments decreases because the Low End and Traditional segments move at slower speeds.
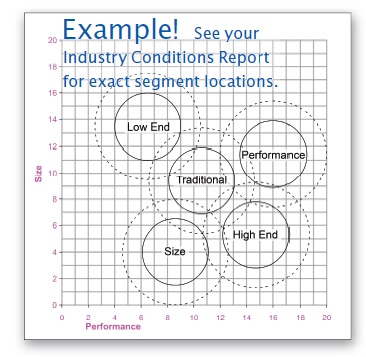
Figure 2.4 Segment Positions at the End of Year 8: The segments have moved to the lower right; very little overlap remains.
Each year, some market segments demand greater improvement than others. Therefore segments drift at different rates. Segments demanding greater improvement will move faster and farther than others. As time goes by, the overlap between the segments diminishes.
Drift rates are published in the Industry Conditions Report. Your drift rates and segment positions might be different.
Market segments will not move faster to catch up with products that are better than customer expectations. Customers will refuse to buy a product positioned outside the circles. Customers are only interested in products that satisfy their needs. This includes being within the circles on the Perceptual Map!
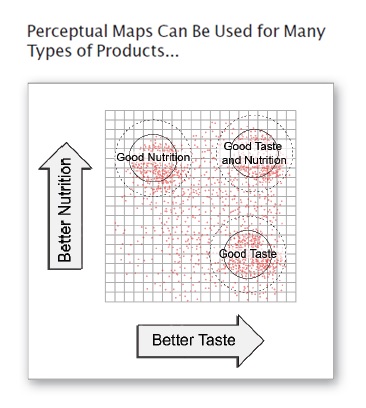
Any two product attributes can be plotted with a perceptual map
Perceptual Maps can be used to plot any two product characteristics. For example, cereal manufacturers could plot nutrition and taste. The dots in the figure below represent sales of breakfast cereals based on ratings of taste and nutrition. There are few sales in the lower-left corner– not many consumers want products that have poor taste and poor nutrition.
As they review product sales, marketers would notice three distinct clusters. The cluster to the upper left indicates a group of customers that is more interested in nutrition than taste. The cluster to the lower right indicates a group that is more interested in taste than nutrition. The cluster to the upper right indicates a group that wants both good taste and good nutrition.
The clusters, or market segments, could then be named “Taste,” “Nutrition” and “Taste/Nutrition.” The simulation uses a similar positioning method to name its market segments.
Your R&D and Marketing Departments have to make sure your products keep up with changing customer preferences. To do this, R&D must reposition products, keeping them within the moving segment circles.