2.1.4 Positioning
Sensors vary in their dimensions (size) and the speed/sensitivity with which they respond to changes in physical conditions (performance). Combining size and performance creates a product attribute called positioning.
The Perceptual Map
Positioning is such an important concept that marketers developed a tool to track the position of their products and those of their competitors. This tool is called a Perceptual Map.
Note the Perceptual Map in Figure 2.1. You will see this map quite often through the course of the simulation.
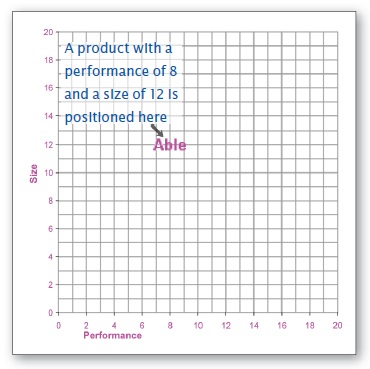
Figure 2.1 The Perceptual Map Used in the Simulation: The Perceptual Map plots product size and performance characteristics.
The map measures size on the vertical axis and performance on the horizontal axis. Each axis extends from 0 to 20 units. The arrow in Figure 2.1 points to a product called Able with a performance measurement of 8.0 and a size of 12.0.