5.5 Segment Analysis Reports
The Segment Analysis reports (pages 5 – 9) review each market segment in detail (Figure 5.1).
The Statistics box in the upper-left corner reports Total Industry Unit Demand, Actual Industry Unit Sales, Segment Percent of Total Industry and Next Year’s Growth Rate. The Customer Buying Criteria box ranks the customer criteria within each segment:
- Ideal Position: The preferred product location, also called the ideal spot, as of December 31 of the previous year– ideal spots drift with the segments, moving a little each month;
- Price: Every year on January 1, price ranges drop by $0.50– this is the price range from last year;
- Age: Age preferences stay the same year after year; and
- Reliability: MTBF requirements stay the same year after year.
Are your products meeting your buyers’ expectations?
The Perceptual Map shows the position of each product in the segment as of December 31 of the previous year.
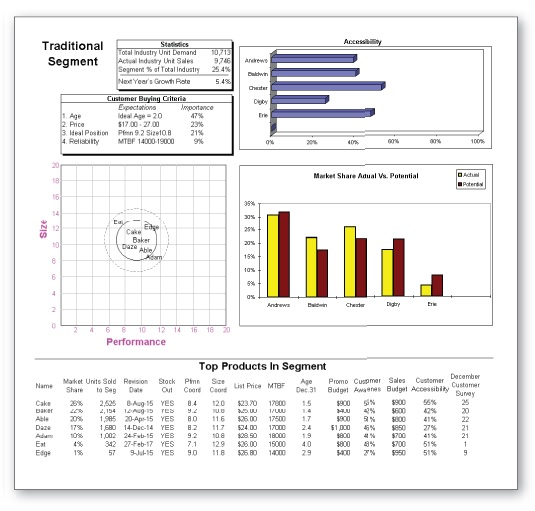
Figure 5.1 Market Segment Analysis: Segment Statistics and Buying Criteria display in the upper-left corner of each segment analysis. Accessibility and Market Share Actual vs. Potential Charts display to the upper right. Customer Awareness Percentages and December Customer Survey Scores display on the lower part of the page.
5.5.1 Accessibility, Market Share and Top Products in Segment
The Accessibility Chart rates each company’s level of accessibility. Accessibility is determined by the Marketing Department’s sales budget– the higher the budget, the higher the accessibility. Accessibility is measured by percentage; 100% means every customer can easily interact with your company– sales, customer support, etc.
The Market Share Actual vs. Potential Chart displays two bars per company. The actual bar reports the market percentage each company attained in the segment. The potential bar indicates what the company deserved to sell in the segment. If the potential bar is higher than the actual, the company under produced and missed sales opportunities. If the potential is lower than the actual, the company picked up sales because other companies under produced and stocked out (ran out of inventory).
The Top Products in Segment area reports, in order of total sales:
- Market Share
- Units Sold to Segment
- Revision Date
- Stock Out (This tells you whether the product ran out of inventory.)
- Performance and Size Coordinates
- Price
- MTBF
- The product’s Age on December 31
- Promotion and sales budgets
- Awareness
- Accessibility
- December Customer Survey Score
5.5.2 Awareness and the December Customer Survey Score
Customer Awareness is determined by the Marketing Department’s promotion budget– the higher the budget, the higher the awareness. Awareness is measured by percentage; 100% means every customer knew about your product.
The December Customer Survey Score indicates how customers in the segment perceived the products. The survey evaluates the product against the buying criteria.
Product ages and distances from ideal spots change throughout the year, therefore scores change month to month.
If a repositioning project concludes late in the year, the survey score for December could be significantly higher than the scores for the previous months.
Use the Customer Survey Score as a quick comparison tool when conducting a competitive analysis. Perfect scores are almost impossible. Scores of 50 or above are considered good.