3.1.2 Price Score
Every segment has a $10.00 price range. Customers prefer products–the ideal–towards the bottom of the range. Price ranges in all segments drop $0.50 per year.
Segment price expectations correlate with the segment’s position on the Perceptual Map. Segments that demand higher performance and smaller sizes are willing to pay higher prices.
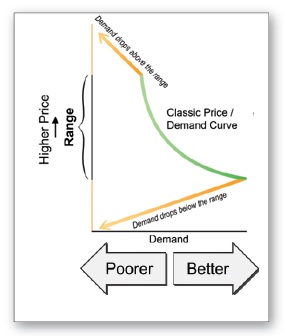
Figure 3.2 Classic Price/Demand Curve (Green Bow): As price drops demand (price score) rises. Scores drop above and below the price range (orange arrows).
Price ranges for Round 0 (the year prior to Round 1) are published in the Industry Conditions Report and the Segment Analysis pages of the Capstone Courier.
Price Rough Cut
Sensors priced $5.00 above or below the segment guidelines will not be considered for purchase. Those products fail the price rough cut.
Sensors priced $1.00 above or below the segment guidelines lose about 20% of their customer survey score (orange arrows, Figure 3.2). Sensors continue to lose approximately 20% of their customer survey score for each dollar above or below the guideline, on up to $4.99, where the score is reduced by approximately 99%. At $5.00 outside the range, demand for the product is zero.
Price Fine Cut
Within each segment’s price range, price scores follow a classic economic demand curve (green curve, Figure 3.2): As price goes down, the price score goes up.
Engaging with Capsim Capstone Business Simulation India is both demanding and rewarding, making it an ideal choice for those serious about developing their business skills and mastering the art of sound decision-making.