Page 4 of 5
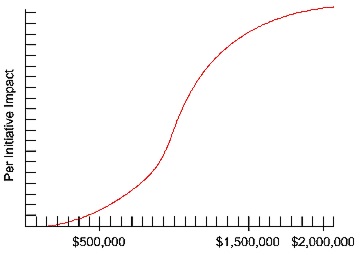
7.1.3 S-Shaped Curve
For each initiative, returns for investments follow the shape of an S-curve (Figure 7.8). That is, if you spend too little or too much the returns on your investment are poor. If you spend less than $500,000 in any initiative in a single round chances are you will see little return. An investment of $1,500,000 in a single round produces a cost-effective impact, investments over $1,500,000 become dollar for dollar less effective. Finally, for each initiative, an investment over $2,000,000 in a single round produces absolutely no additional benefit.
For each impact, complementary initiatives combine together to increase the total effect. You should bundle your investments in multiple initiatives that have an impact important to your company’s strategy. By spreading your investment among complementary initiatives you can invest more in each impact than the limit of $2,000,000 for an individual initiative.
You can target multiple impacts, such as both material and labor cost reduction; this can be a substantial investment in any given year. As you fine tune your decisions, keep an eye on the Projected Cumulative Impacts to ensure that your investments are creating cost-effective returns.
Companies that invest in the same initiatives over two or three rounds (depending on the amount of money) will experience decreasing and eventually no additional returns for their investments.
S-Shaped Curve
Expenditures beyond $4,000,000 over two or three years in each initiative pushes well into diminishing returns.
For example, suppose a company wants to reduce the time required to complete R&D projects by investing in Concurrent Engineering and Quality Function Deployment. An aggressive schedule would be $1,500,000 this year (staying within acceptable diminishing returns); $1,500,000 next year (which would not produce as much benefit, but would continue to improve R&D cycle time); and $1,000,000 in the third year.
The TQM area displays the projected impacts for the current year. As companies make decisions, worst-case/best-case sets of outcomes are predicted. These are also carried into the proformas. The spreadsheet can only offer a range of possible savings. Actual results appear the following round on page 12 of The Capstone Courier in the HR/TQM Report.